Gigabyte GeForce GTX 680 OC Windforce 3X - Übertaktete GeForce im Test (16/17)
Gigabyte GeForce GTX 680 Windforce Overclocking
GPU-Boost und Base/Boost-Clock Overclocking - Was bringt es
Wie wir bereits beim
Overclocking des Referenzdesigns der GeForce GTX 680 gesehen
haben, arbeitet die GPU der Karten dank GPU-Boost auch deutlich über dem
eingestellten Boost-Clock von 1058 MHz. Der eigentliche Base-Clock wird
zumeist nur dann angesteuert, wenn das Power-Limit der Karte sehr im
Grenzbereich liegt. Der Boost-Clock selbst ist eigentlich mehr oder weniger
nur eine "minimale Boost-Garantie" aber nicht die endgültige Taktrate.
Die Gigabyte GeForce GTX 680 Windforce 3X hat nicht nur einen höhere Base-
und Boost-Clock, sie ist zudem mit einem 8 und 6 Pol PCIe Stecker
ausgestattet und verfügt direkt über ein angehobenes Power-Limit. Das Board
darf also deutlich mehr Strom ziehen als ein übliches Referenzdesign der GTX
680. Dazu kann das Power-Limit zusätzlich per Software noch einmal um 11%
erhöht werden, was aber nur bei extremem Overclocking relevant ist.
Mit den Standard-Einstellungen testen wir auch bei dieser Karte erneut
wie sie in den 4 Game Tests von 3DMark 11 taktet, da diese schön
verschiedene Game Situationen darstellen. Eine normale GeForce GTX 680
schwankt im ersten und zweiten Test deutlich mit der Taktfrequenz und
erreicht schnell das
Powerlimit, im Test 3 und 4 dagegen kann GPU Boost gut hoch takten, da das
Powerlimit hier nicht erreicht wird. (Zu sehen in unserem ersten
GeForce GTX 680 Artikel unter GPU-Boost)
Bei der Gigabyte GeForce GTX 680 Windforce 3X sieht es so aus, dass das
Powerlimit der Karte mit den eingestellten Taktraten generell kaum erreicht
wird und sie sich deshalb über den gesamten 3DMark 11 Test auf eine hohe
Taktrate festsetzt. Diese Taktrate liegt bei etwa 1124 bis 1137 MHz, oft
dauert es ein Wenig bis die Karte den maximalen Boost-Clock von 1137 MHz erreicht. Dieser
Takt liegt aber dann auch nicht viel höher als bei einem guten Referenzmodell,
dessen Powerlimit man künstlich erhöht.
Man sieht also, dass der in Wirklichkeit gefahrene Takt nicht unbedingt
vom Base- und Boost-Clock abhängt, sondern von der "Güte" der verwendeten
GPU. Sprich der erhöhte Base- und Boost-Clock heißt nicht unbedingt, dass diese Karte
im Boost-Modus dann am Ende dann auch schneller als eine Karte mit Standard
Taktraten ist.
Natürlich kann man die Karte wieder mittels Offset noch weiter übertakten.
Bei der Gigabyte Karte gelinkt das sogar recht gut mit 140 bis 150 MHz.
Bei der GTX 680 ist das übertakten recht stark vom gewählten
Benchmark abhängig. Lässt sich die Karte in manchen Benchmarks locker
noch mehr als 150 MHz übertakten so gibt es einige Benchmarks wo sie sich
auch schon einmal deutlich schlechter übertakten lässt. Unser Modell der
Gigabyte Karte erreicht im 3DMark 11 stolze Taktraten von 1269 MHz, darüber
kam es zum Crash.
Diese hohe Taktrate ist aber nicht in jedem Benchmark konstant. Das heißt
dass eine so übertaktete Karte in gewissen Benchmarks auch wieder zurück
fallen kann. Den größten Nutzen aus einer via Base-Clock übertakteten Karte
erzielt
man eigentlich dann, wenn ein Game das Powerlimit nahezu auslastet und die
Karte auf den Base-Clock zurück fällt. Eine normale GeForce GTX 680 würde in
diesem Fall nur noch mit 1006 MHz takten, die Gigabyte Karte immerhin mit 65
MHz mehr, also mit 1071 MHz. Je mehr ein Game das Powerllimit auslastet,
desto besser rennt also eine Karte mit erhöhtem Base-Clock.
Um diese Situation zu testen haben wir einfach einmal den Furmark
angeschlossen, der eine normale GeForce GTX sofort auf 1006 MHz oder
teilweise sogar darunter takten lässt.
Referenzdesign einer GTX 680 mit Base-Clock 1006 MHz unter Furmark
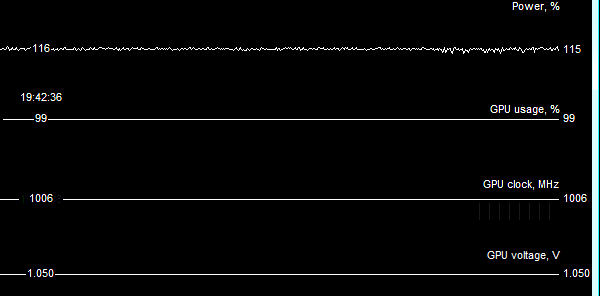
Schaut man sich dagegen die Gigabyte Karte an, so erreicht diese kaum ihr
Powerlimit und fällt nicht etwa auf den Base-Clock von 1071 zurück sondern
taktet munter auch unter Furmark noch auf 1110/1124 bis hin zu 1137 MHz
hoch!

Gigabyte GeForce GTX 680 Windforce mit Base-Clock 1071 MHz unter Furmark
In dieser Worst Case Situation taktet die Karte also damit 104 MHz höher
als ein Standard Modell. Die Auswirkungen auf die Performance sind dabei
allerdings nicht so hoch, denn diese Worst-Case-Situation tritt in der
Praxis in echten Games nur selten auf. Der 3DMark Vantage profitiert zum
Beispiel von der Situation.
3DMark 2011
| NVIDIA GeForce GTX 680 SLI | | NVIDIA GeForce GTX 690 | | Gigabyte GeForce GTX 680 Windforce OC | | AMD Radeon HD 6990 | | Gigabyte GeForce GTX 680 Windforce | | Gainward GeForce GTX 680 Phantom 4GB | | NVIDIA GeForce GTX 680 | | NVIDIA GeForce GTX 590 | | AMD Radeon HD 7970 | | AMD Radeon HD 7950 | | AMD Radeon HD 7870 | | NVIDIA GeForce GTX 580 | | AMD Radeon HD 6970 | | NVIDIA GeForce GTX 570 | | NVIDIA GeForce GTX 480 | | AMD Radeon HD 7850 | | AMD Radeon HD 6950 | | ATI Radeon HD 5870 | | NVIDIA GeForce GTX 560 TI | | NVIDIA GeForce GTX 470 | | NVIDIA GeForce GTX 560 | | AMD Radeon HD 6870 | | ATI Radeon HD 5850 | | AMD Radeon HD 6850 | | AMD Radeon HD 7770 | | NVIDIA GeForce GTX 460 | | NVIDIA GeForce GTX 465 | | ATI Radeon HD 5770/6770 | | NVIDIA GeForce GTS 450 |
|
 5042 [152%] 5042 [152%] | | 4855 [147%] |  3712 [112%] 3712 [112%] | | 3315 [100%] |  3311 [100%] 3311 [100%] | | 3292 [99%] | | 3199 [97%] | | 2985 [90%] | | 2704 [82%] | | 2252 [68%] | | 2032 [61%] | | 1952 [59%] | | 1819 [55%] | | 1695 [51%] | | 1682 [51%] | | 1620.0 [49%] | | 1612 [49%] | | 1579 [48%] | | 1412 [43%] | | 1342 [41%] | | 1312 [40%] | | 1311 [40%] | | 1311 [40%] | | 1130 [34%] | | 1086 [33%] | | 1052 [32%] | | 980 [30%] | | 890 [27%] | | 680 [21%] | | 3DMark 2011 - Extreme - |
|
|
3DMark 2011 GPU Score
| NVIDIA GeForce GTX 680 SLI | | NVIDIA GeForce GTX 690 | | Gigabyte GeForce GTX 680 Windforce OC | | Gigabyte GeForce GTX 680 Windforce | | Gainward GeForce GTX 680 Phantom 4GB | | AMD Radeon HD 6990 | | NVIDIA GeForce GTX 680 | | NVIDIA GeForce GTX 590 | | AMD Radeon HD 7970 | | AMD Radeon HD 7950 | | AMD Radeon HD 7870 | | NVIDIA GeForce GTX 580 | | AMD Radeon HD 6970 | | NVIDIA GeForce GTX 570 | | NVIDIA GeForce GTX 480 | | AMD Radeon HD 7850 | | AMD Radeon HD 6950 | | ATI Radeon HD 5870 | | NVIDIA GeForce GTX 560 TI | | NVIDIA GeForce GTX 470 | | ATI Radeon HD 5850 | | AMD Radeon HD 6870 | | NVIDIA GeForce GTX 560 | | AMD Radeon HD 6850 | | AMD Radeon HD 7770 | | NVIDIA GeForce GTX 460 | | NVIDIA GeForce GTX 465 | | ATI Radeon HD 5770/6770 | | NVIDIA GeForce GTS 450 |
|
| 5879 [192%] | | 5508 [180%] | | 3452 [113%] | | 3067 [100%] | | 3043 [99%] | | 3042 [99%] | | 2959 [96%] | | 2821 [92%] | | 2472 [81%] | | 2042 [67%] | | 1846 [60%] | | 1767 [58%] | | 1636 [53%] | | 1533 [50%] | | 1515 [49%] | | 1451.0 [47%] | | 1446 [47%] | | 1417 [46%] | | 1264 [41%] | | 1206 [39%] | | 1171 [38%] | | 1169 [38%] | | 1164 [38%] | | 1003 [33%] | | 973 [32%] | | 939 [31%] | | 874 [28%] | | 794 [26%] | | 606 [20%] | | 3DMark 2011 GPU Score - Extreme - |
|
|
3DMark Vantage
| NVIDIA GeForce GTX 680 SLI | | NVIDIA GeForce GTX 690 | | NVIDIA GeForce GTX 590 | | Gigabyte GeForce GTX 680 Windforce OC | | Gigabyte GeForce GTX 680 Windforce | | Gainward GeForce GTX 680 Phantom 4GB | | NVIDIA GeForce GTX 680 | | AMD Radeon HD 6990 | | AMD Radeon HD 7970 | | AMD Radeon HD 7950 | | NVIDIA GeForce GTX 580 | | AMD Radeon HD 7870 | | NVIDIA GeForce GTX 570 | | AMD Radeon HD 6970 | | NVIDIA GeForce GTX 480 | | AMD Radeon HD 7850 | | ATI Radeon HD 5870 | | NVIDIA GeForce GTX 560 TI | | AMD Radeon HD 6950 | | NVIDIA GeForce GTX 560 | | NVIDIA GeForce GTX 470 | | AMD Radeon HD 6870 | | ATI Radeon HD 5850 | | NVIDIA GeForce GTX 460 | | ATI Radeon HD 5830 | | AMD Radeon HD 7770 | | AMD Radeon HD 6850 | | NVIDIA GeForce GTX 460 768 | | NVIDIA GeForce GTX 285 | | NVIDIA GeForce GTX 465 | | NVIDIA GeForce GTX 275 | | ATI Radeon HD 4890 | | NVIDIA GeForce GTX 260 | | NVIDIA GeForce GTS 450 | | ATI Radeon HD 5770/6770 | | ATI Radeon HD 4870 | | ATI Radeon HD 5750/6750 | | ATI Radeon HD 5750 512 | | ATI Radeon HD 4850 | | ATI Radeon HD 4770 |
|
| 30610 [158%] | | 29433 [152%] | | 20799 [108%] | | 19851 [103%] | | 19334 [100%] | | 19010 [98%] | | 18851 [98%] | | 18370 [95%] | | 17392 [90%] | | 14067 [73%] | | 12892 [67%] | | 12174 [63%] | | 11144 [58%] | | 10870 [56%] | | 9969 [52%] | | 9622.0 [50%] | | 9382 [49%] | | 9369 [48%] | | 9363 [48%] | | 8251 [43%] | | 7908 [41%] | | 7661 [40%] | | 7528 [39%] | | 6904 [36%] | | 6705 [35%] | | 6375 [33%] | | 6094 [32%] | | 6056 [31%] | | 6042 [31%] | | 6000 [31%] | | 5670 [29%] | | 4938 [26%] | | 4687 [24%] | | 4396 [23%] | | 4354 [23%] | | 4142 [21%] | | 3516 [18%] | | 3300 [17%] | | 3254 [17%] | | 3125 [16%] | | 3D Mark Vantage - 1920x1080 Extreme - |
|
|
3DMark Vantage GPU Score
| NVIDIA GeForce GTX 680 SLI | | NVIDIA GeForce GTX 690 | | NVIDIA GeForce GTX 590 | | Gigabyte GeForce GTX 680 Windforce | | Gigabyte GeForce GTX 680 Windforce OC | | Gainward GeForce GTX 680 Phantom 4GB | | NVIDIA GeForce GTX 680 | | AMD Radeon HD 6990 | | AMD Radeon HD 7970 | | AMD Radeon HD 7950 | | NVIDIA GeForce GTX 580 | | AMD Radeon HD 7870 | | NVIDIA GeForce GTX 570 | | AMD Radeon HD 6970 | | NVIDIA GeForce GTX 480 | | AMD Radeon HD 7850 | | ATI Radeon HD 5870 | | NVIDIA GeForce GTX 560 TI | | AMD Radeon HD 6950 | | NVIDIA GeForce GTX 560 | | NVIDIA GeForce GTX 470 | | AMD Radeon HD 6870 | | ATI Radeon HD 5850 | | NVIDIA GeForce GTX 460 | | ATI Radeon HD 5830 | | AMD Radeon HD 7770 | | AMD Radeon HD 6850 | | NVIDIA GeForce GTX 460 768 | | NVIDIA GeForce GTX 285 | | NVIDIA GeForce GTX 465 | | NVIDIA GeForce GTX 275 | | ATI Radeon HD 4890 | | NVIDIA GeForce GTX 260 | | NVIDIA GeForce GTS 450 | | ATI Radeon HD 5770/6770 | | ATI Radeon HD 4870 | | ATI Radeon HD 5750/6750 | | ATI Radeon HD 5750 512 | | ATI Radeon HD 4850 | | ATI Radeon HD 4770 |
|
| 31158 [162%] | | 29960 [156%] | | 20736 [108%] | | 19207 [100%] | | 19145 [100%] | | 18861 [98%] | | 18703 [97%] | | 18197 [95%] | | 17194 [90%] | | 13802 [72%] | | 12613 [66%] | | 11898 [62%] | | 10859 [57%] | | 10582 [55%] | | 9688 [50%] | | 9342.0 [49%] | | 9103 [47%] | | 9092 [47%] | | 9088 [47%] | | 7985 [42%] | | 7648 [40%] | | 7405 [39%] | | 7276 [38%] | | 6661 [35%] | | 6466 [34%] | | 6146 [32%] | | 5869 [31%] | | 5831 [30%] | | 5819 [30%] | | 5778 [30%] | | 5416 [28%] | | 4743 [25%] | | 4500 [23%] | | 4197 [22%] | | 4177 [22%] | | 3972 [21%] | | 3366 [18%] | | 3158 [16%] | | 3114 [16%] | | 2989 [16%] | | 3D Mark GPU Score - 1920x1080 Extreme - |
|
|
Heaven 2.1 Extreme Mode
| NVIDIA GeForce GTX 680 SLI | | NVIDIA GeForce GTX 690 | | Gigabyte GeForce GTX 680 Windforce OC | | NVIDIA GeForce GTX 590 | | NVIDIA GeForce GTX 680 | | Gigabyte GeForce GTX 680 Windforce | | Gainward GeForce GTX 680 Phantom 4GB | | AMD Radeon HD 6990 | | AMD Radeon HD 7970 | | AMD Radeon HD 7950 | | NVIDIA GeForce GTX 580 | | AMD Radeon HD 6970 | | AMD Radeon HD 7870 | | NVIDIA GeForce GTX 570 | | AMD Radeon HD 6950 | | NVIDIA GeForce GTX 480 | | AMD Radeon HD 7850 | | NVIDIA GeForce GTX 470 | | NVIDIA GeForce GTX 560 TI | | AMD Radeon HD 7770 | | AMD Radeon HD 6870 | | ATI Radeon HD 5870 | | NVIDIA GeForce GTX 560 | | AMD Radeon HD 6850 | | NVIDIA GeForce GTX 465 | | ATI Radeon HD 5850 | | NVIDIA GeForce GTX 460 | | ATI Radeon HD 5830 | | NVIDIA GeForce GTX 460 768 | | ATI Radeon HD 5770/6770 | | NVIDIA GeForce GTS 450 | | ATI Radeon HD 5750/6750 |
|
| 90.6 [183%] | | 87.6 [177%] | | 55.53 [112%] | | 51.0 [103%] | | 49.5 [100%] | | 49.4 [100%] | | 49.3 [100%] | | 45.7 [93%] | | 41.6 [84%] | | 36.0 [73%] | | 34.3 [69%] | | 32.8 [66%] | | 31.4 [64%] | | 29.8 [60%] | | 28.9 [59%] | | 28.6 [58%] | | 28.1 [57%] | | 22.6 [46%] | | 22.4 [45%] | | 21.8 [44%] | | 21.1 [43%] | | 20.6 [42%] | | 19.6 [40%] | | 17.8 [36%] | | 17.6 [36%] | | 17.3 [35%] | | 16.7 [34%] | | 16.3 [33%] | | 15.7 [32%] | | 11.9 [24%] | | 10.7 [22%] | | 5.9 [12%] | | Heaven 2.5 Pro (DX11/Extreme) - 1920x1200 4AAx16AF |
|
|
Alien vs. Predator Benchmark
| NVIDIA GeForce GTX 680 SLI | | NVIDIA GeForce GTX 690 | | AMD Radeon HD 6990 | | NVIDIA GeForce GTX 590 | | Gigabyte GeForce GTX 680 Windforce OC | | AMD Radeon HD 7970 | | Gigabyte GeForce GTX 680 Windforce | | NVIDIA GeForce GTX 680 | | Gainward GeForce GTX 680 Phantom 4GB | | AMD Radeon HD 7950 | | NVIDIA GeForce GTX 580 | | AMD Radeon HD 6970 | | AMD Radeon HD 7870 | | NVIDIA GeForce GTX 480 | | AMD Radeon HD 6950 | | NVIDIA GeForce GTX 570 | | AMD Radeon HD 7850 | | ATI Radeon HD 5870 | | NVIDIA GeForce GTX 560 TI | | NVIDIA GeForce GTX 470 | | NVIDIA GeForce GTX 560 | | AMD Radeon HD 6870 | | ATI Radeon HD 5850 | | NVIDIA GeForce GTX 460 | | AMD Radeon HD 6850 | | ATI Radeon HD 5770/6770 | | AMD Radeon HD 7770 | | ATI Radeon HD 5830 | | NVIDIA GeForce GTS 450 |
|
| 98.5 [189%] | | 97.7 [188%] | | 76.8 [148%] | | 67.0 [129%] | | 59.8 [115%] | | 59.3 [114%] | | 52.0 [100%] | | 52.0 [100%] | | 51.8 [100%] | | 49.8 [96%] | | 42.7 [82%] | | 41.8 [80%] | | 41.6 [80%] | | 37.2 [72%] | | 36.3 [70%] | | 35.9 [69%] | | 34.7 [67%] | | 31.4 [60%] | | 30.1 [58%] | | 29.3 [56%] | | 26.8 [52%] | | 26.4 [51%] | | 26.1 [50%] | | 22.9 [44%] | | 22.4 [43%] | | 21.1 [41%] | | 21.1 [41%] | | 21.0 [40%] | | 15.6 [30%] | | Alien vs Predator (DX11) - 1920x1200 4AAx16AF |
|
|
Battleforge
| NVIDIA GeForce GTX 680 SLI | | NVIDIA GeForce GTX 690 | | NVIDIA GeForce GTX 590 | | Gigabyte GeForce GTX 680 Windforce OC | | Gigabyte GeForce GTX 680 Windforce | | AMD Radeon HD 6990 | | Gainward GeForce GTX 680 Phantom 4GB | | NVIDIA GeForce GTX 680 | | AMD Radeon HD 7970 | | AMD Radeon HD 7950 | | NVIDIA GeForce GTX 580 | | AMD Radeon HD 7870 | | NVIDIA GeForce GTX 570 | | NVIDIA GeForce GTX 480 | | AMD Radeon HD 7850 | | NVIDIA GeForce GTX 560 TI | | NVIDIA GeForce GTX 470 | | AMD Radeon HD 6970 | | ATI Radeon HD 5870 | | NVIDIA GeForce GTX 560 | | AMD Radeon HD 6950 | | AMD Radeon HD 6870 | | ATI Radeon HD 5850 | | NVIDIA GeForce GTX 465 | | AMD Radeon HD 7770 | | AMD Radeon HD 6850 | | NVIDIA GeForce GTX 460 | | ATI Radeon HD 5830 | | NVIDIA GeForce GTX 460 768 | | ATI Radeon HD 5770/6770 | | ATI Radeon HD 4890 | | NVIDIA GeForce GTS 450 | | ATI Radeon HD 4870 | | ATI Radeon HD 5750/6750 | | NVIDIA GeForce GTX 285 | | ATI Radeon HD 5750 512 | | NVIDIA GeForce GTX 275 | | NVIDIA GeForce GTX 260 | | ATI Radeon HD 4850 | | ATI Radeon HD 4770 |
|
| 182.4 [183%] | | 174.1 [174%] | | 115.2 [115%] | | 112.98 [113%] | | 99.8 [100%] | | 98.8 [99%] | | 97.3 [97%] | | 96.3 [96%] | | 95.4 [96%] | | 81.9 [82%] | | 72.1 [72%] | | 71.4 [72%] | | 63.8 [64%] | | 62.5 [63%] | | 61.9 [62%] | | 49.9 [50%] | | 49.9 [50%] | | 48.0 [48%] | | 46.9 [47%] | | 44.6 [45%] | | 42.1 [42%] | | 40.9 [41%] | | 39.5 [40%] | | 39.3 [39%] | | 35.8 [36%] | | 35.3 [35%] | | 34.7 [35%] | | 33.0 [33%] | | 32.8 [33%] | | 27.4 [27%] | | 24.9 [25%] | | 22.2 [22%] | | 22.2 [22%] | | 21.3 [21%] | | 21.1 [21%] | | 19.6 [20%] | | 19.1 [19%] | | 17.3 [17%] | | 14.9 [15%] | | 13.8 [14%] | | Battleforge (SSAO/DX11) - 1920x1200 4AAx16AF |
|
|
Dirt2
| NVIDIA GeForce GTX 690 | | NVIDIA GeForce GTX 590 | | NVIDIA GeForce GTX 680 SLI | | Gigabyte GeForce GTX 680 Windforce OC | | NVIDIA GeForce GTX 680 | | Gigabyte GeForce GTX 680 Windforce | | Gainward GeForce GTX 680 Phantom 4GB | | AMD Radeon HD 6990 | | AMD Radeon HD 7970 | | NVIDIA GeForce GTX 580 | | AMD Radeon HD 7950 | | NVIDIA GeForce GTX 570 | | AMD Radeon HD 7870 | | NVIDIA GeForce GTX 480 | | AMD Radeon HD 7850 | | AMD Radeon HD 6970 | | NVIDIA GeForce GTX 560 TI | | NVIDIA GeForce GTX 560 | | NVIDIA GeForce GTX 470 | | ATI Radeon HD 5870 | | AMD Radeon HD 6950 | | AMD Radeon HD 6870 | | NVIDIA GeForce GTX 460 | | ATI Radeon HD 5850 | | NVIDIA GeForce GTX 460 768 | | AMD Radeon HD 6850 | | NVIDIA GeForce GTX 465 | | AMD Radeon HD 7770 | | ATI Radeon HD 5830 | | ATI Radeon HD 4870 | | ATI Radeon HD 5770/6770 | | NVIDIA GeForce GTS 450 | | ATI Radeon HD 5750/6750 | | ATI Radeon HD 5750 512 |
|
| 164.5 [112%] | | 160.8 [109%] | | 157.8 [107%] | | 155.51 [106%] | | 149.2 [101%] | | 147.0 [100%] | | 145.4 [99%] | | 124.5 [85%] | | 120.0 [82%] | | 111.5 [76%] | | 104.4 [71%] | | 96.5 [66%] | | 95.1 [65%] | | 90.8 [62%] | | 83.9 [57%] | | 83.3 [57%] | | 82.3 [56%] | | 74.1 [50%] | | 73.5 [50%] | | 72.3 [49%] | | 71.2 [48%] | | 65.0 [44%] | | 63.4 [43%] | | 62.0 [42%] | | 58.2 [40%] | | 57.7 [39%] | | 56.6 [39%] | | 54.8 [37%] | | 53.5 [36%] | | 51.5 [35%] | | 43.6 [30%] | | 40.2 [27%] | | 31.5 [21%] | | 30.6 [21%] | | Dirt 2 (DX11) - 1920x1200 4AAx16AF |
|
|


 Zurück:
  Weiter:
  [1]
[1]