Corsair MP600 Core Gen4 M.2 NVMe SSD im Test (9/12)
Pattern-Tests (Enterprise / Server Performance)
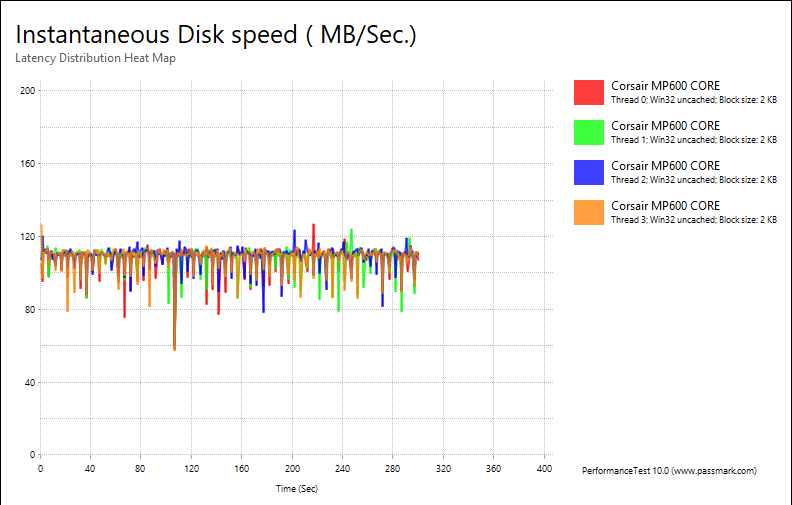
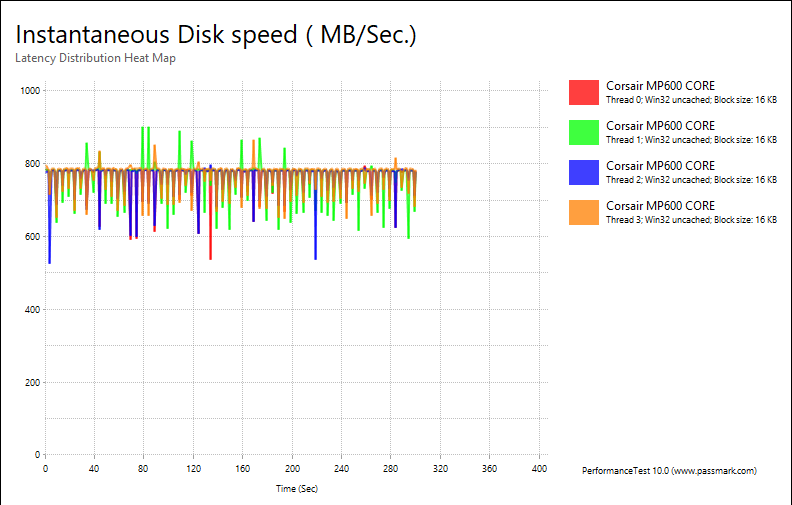
Verschiedene Pattern Profile im Einsatz mit 1 bis 4 Workern/Threads
Bei den folgenden Test wird die SSD mit verschiedenen Patterns "bearbeitet". Dabei finden jeweils Schreib- und Lesezugriffe auf der SSD nach einem bestimmten Muster statt. Jeder Test dauert 5 Minuten und der Datendurchsatz wird am Ende anhand eines Kurvendiagramms ausgegeben. Die Tests sind erheblich anspruchsvoller als typische SSD-Benchmarks und orientieren sich mehr am Einsatz in professionellen Workstations oder Servern und weniger an den typischen Desktop- oder Gaming-PCs. Sie sind daher aber auch in Teilen deutlich aussagekräftiger als übliche SSD-Benchmarks
Zum Einsatz kommen folgende Patterns.
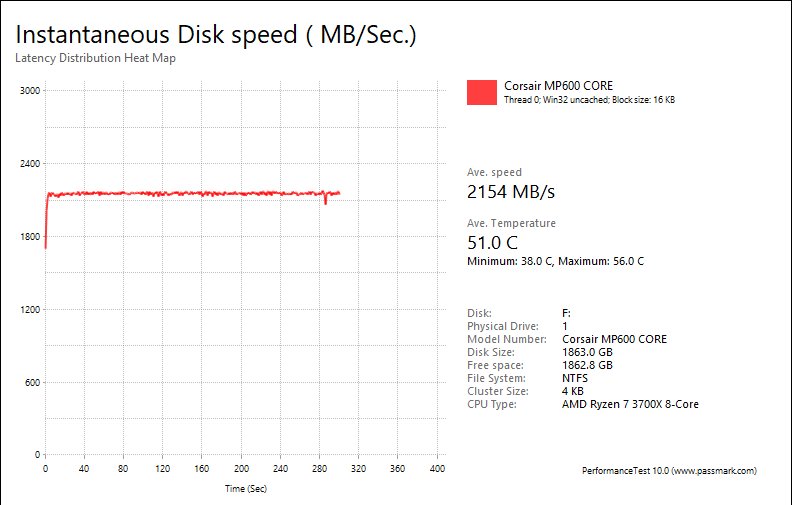
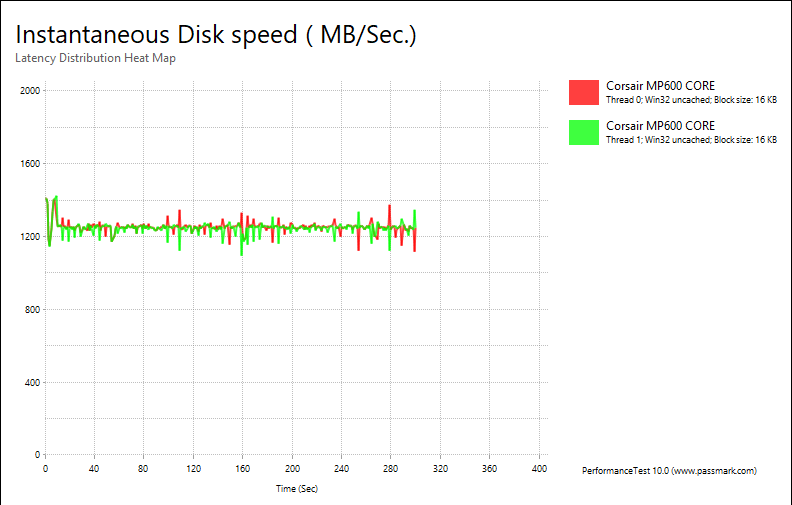
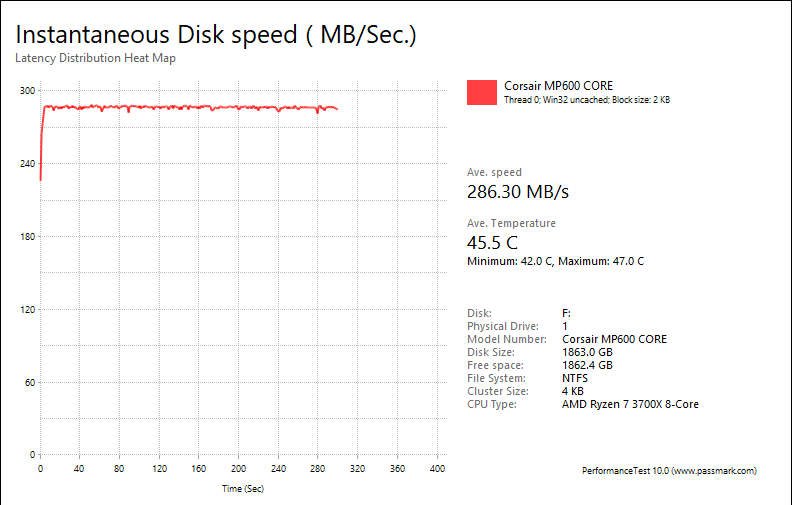
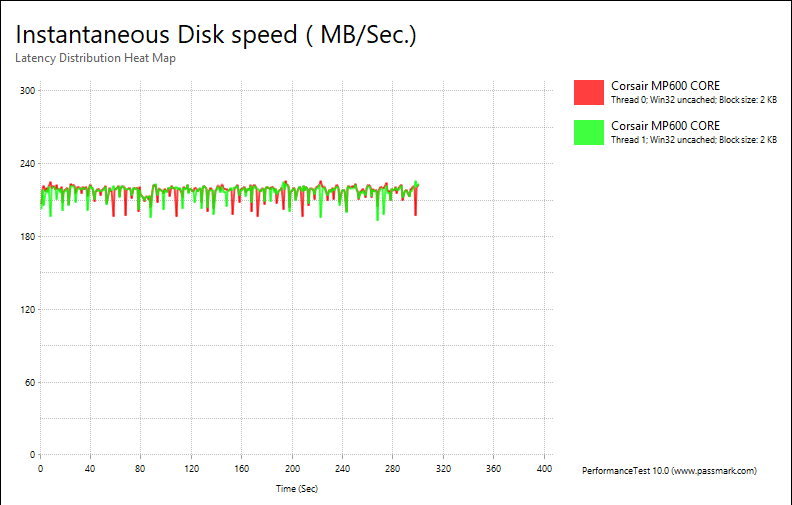
- Workstation: read 70% write 30% - sequentiell 20% random 80%
- Database: read 90 % write 10% - sequentiell 10% random 90%
- File Server: read 80 % write 20% - sequentiell 0% random 100%
- Webserver: read 100 % write 0% - sequentiell 0% random 100%
Beim den Pattern-Tests zeigt sich, dass die Unterschiede zwischen den SSDs deutlich geringer ausfallen, als in den theoretischen Test. Treffen Lese- und Schreibzugriff aufeinander und sind nicht strikt voneinander getrennt, so fällt die Performance der SSDs generell deutlich gegenüber den reinen Lese/Schreib-Benchmarks ab. Die verschiedenen Patterns lassen sich zudem mit sogenannten "Workern" oder "Threads" vervielfachen um so die Belastung der SSD weiter zu steigen. Im Folgenden führen wir die Tests jeweils mit 1,2 und 4 Threads durch, um die Schwankungen der Performance und die Multithread-Fähigkeiten der SSDs zu beurteilen. Gerade die Tests mit mehreren Threads entsprechend eher einer Beurteilung im Server-Bereich und weniger dem typischen Desktop-Einsatz.
KIOXIA Exceria PLUS 2TB | Corsair Force MP600 1TB | Patriot VIPER VPR100 1TB | Patriot VIPER VP4100 1TB | Patriot VIPER VPN100 1TB | Corsair Force MP510 960 | Kioxia Toshiba RC500 | WD Black SN750 | Corsair Neutron NX500 | Toshiba RC100 | Toshiba OCZ RD400 512 | KIOXIA Exceria | Corsair MP600 Core 2TB | Corsair MP500 | Corsair MP400 2TB | Samsung SM951 | Intel 600P 512 | Plextor M9Pe 512 | WD WD_BLACK P50 Game Drive SSD 1TB | Samsung XP941 | Toshiba OCZ VX500 | OCZ RevoDrive 350 | Plextor M6e | Intel 600P 256 | Intel 660P 1TB | Patriot Patriot PXD USB 3.2 1TB | HP Portable SSD P600 1TB | Toshiba TR200 |
|
363.34 [100%] | 356.3 [98%] | 356 [98%] | 355.9 [98%] | 354.2 [97%] | 350 [96%] | 329.1 [91%] | 323.05 [89%] | 280.8 [77%] | 279.8 [77%] | 277.3 [76%] | 270.82 [75%] | 269.8 [74%] | 264.1 [73%] | 255.7 [70%] | 255 [70%] | 247.2 [68%] | 227.3 [63%] | 223.1 [61%] | 207.3 [57%] | 173.9 [48%] | 159.8 [44%] | 138.6 [38%] | 134.2 [37%] | 132.16 [36%] | 121.2 [33%] | 106.22 [29%] | 102.9 [28%] | Passmark Advanced Disk Test - Workstation 2X - |
|
|
Patriot VIPER VPN100 1TB | WD Black SN750 | Corsair MP400 2TB | Corsair MP600 Core 2TB | Corsair Force MP510 960 | Patriot VIPER VPR100 1TB | KIOXIA Exceria PLUS 2TB | Corsair Force MP600 1TB | Patriot VIPER VP4100 1TB | KIOXIA Exceria | Kioxia Toshiba RC500 | OCZ RevoDrive 350 | Toshiba OCZ RD400 512 | Plextor M9Pe 512 | WD WD_BLACK P50 Game Drive SSD 1TB | Toshiba RC100 | Corsair Neutron NX500 | Intel 600P 512 | Samsung SM951 | Corsair MP500 | Patriot Patriot PXD USB 3.2 1TB | Intel 600P 256 | Samsung XP941 | Intel 660P 1TB | Toshiba OCZ VX500 | Plextor M6e | Toshiba TR200 | HP Portable SSD P600 1TB |
|
2683 [100%] | 2381 [89%] | 2207.91 [82%] | 2154 [80%] | 2131 [79%] | 2100 [78%] | 2098 [78%] | 2077 [77%] | 2071 [77%] | 1491 [56%] | 1461 [54%] | 1196 [45%] | 1173 [44%] | 1118 [42%] | 1084 [40%] | 1016 [38%] | 982.6 [37%] | 924.5 [34%] | 839 [31%] | 777.9 [29%] | 714 [27%] | 617.2 [23%] | 601.5 [22%] | 498.67 [19%] | 458 [17%] | 432.3 [16%] | 257.1 [10%] | 141.8 [5%] | Passmark Advanced Disk Test - File Server - |
|
|
Patriot VIPER VPN100 1TB | Corsair Neutron NX500 | Toshiba OCZ RD400 512 | WD Black SN750 | Plextor M9Pe 512 | Corsair Force MP510 960 | Corsair MP600 Core 2TB | OCZ RevoDrive 350 | Kioxia Toshiba RC500 | Patriot VIPER VPR100 1TB | KIOXIA Exceria PLUS 2TB | Patriot VIPER VP4100 1TB | Corsair Force MP600 1TB | Samsung SM951 | Corsair MP400 2TB | Corsair MP500 | Toshiba OCZ VX500 | Intel 600P 512 | KIOXIA Exceria | Intel 660P 1TB | Plextor M6e | WD WD_BLACK P50 Game Drive SSD 1TB | Samsung XP941 | Intel 600P 256 | Toshiba RC100 | Patriot Patriot PXD USB 3.2 1TB | Toshiba TR200 | HP Portable SSD P600 1TB |
|
405.8 [100%] | 358.6 [88%] | 345.9 [85%] | 319.46 [79%] | 290.8 [72%] | 289.9 [71%] | 286.3 [71%] | 285.6 [70%] | 273.3 [67%] | 273.1 [67%] | 271.66 [67%] | 271.3 [67%] | 271.1 [67%] | 233.7 [58%] | 232.32 [57%] | 231.4 [57%] | 230.6 [57%] | 228.3 [56%] | 217.3 [54%] | 168 [41%] | 162.6 [40%] | 144.7 [36%] | 133.4 [33%] | 130.9 [32%] | 90.9 [22%] | 89.8 [22%] | 52.8 [13%] | 16.4 [4%] | Passmark Advanced Disk Test - Data Base - |
|
|
WD Black SN750 | Corsair MP400 2TB | Corsair MP600 Core 2TB | Corsair Force MP510 960 | Patriot VIPER VPR100 1TB | KIOXIA Exceria PLUS 2TB | Patriot VIPER VPN100 1TB | Corsair Force MP600 1TB | Patriot VIPER VP4100 1TB | Corsair MP500 | Corsair Neutron NX500 | Kioxia Toshiba RC500 | KIOXIA Exceria | Samsung SM951 | Toshiba RC100 | Intel 600P 512 | WD WD_BLACK P50 Game Drive SSD 1TB | Plextor M9Pe 512 | Toshiba OCZ RD400 512 | OCZ RevoDrive 350 | Intel 660P 1TB | Intel 600P 256 | Patriot Patriot PXD USB 3.2 1TB | Samsung XP941 | Plextor M6e | Toshiba OCZ VX500 | Toshiba TR200 | HP Portable SSD P600 1TB |
|
2469 [100%] | 2277.93 [92%] | 2232 [90%] | 2199 [89%] | 2148 [87%] | 2138 [87%] | 2123 [86%] | 2120 [86%] | 2119 [86%] | 1726.1 [70%] | 1710 [69%] | 1632 [66%] | 1620 [66%] | 1358.3 [55%] | 1192 [48%] | 1157.9 [47%] | 1111 [45%] | 1107 [45%] | 1022 [41%] | 987.4 [40%] | 759.4 [31%] | 759.1 [31%] | 732.3 [30%] | 730.5 [30%] | 565.5 [23%] | 480.4 [19%] | 394.5 [16%] | 287.6 [12%] | Passmark Advanced Disk Test - Web Server - |
|
|
Workstation Pattern (1,2,4 Threads)


File Server Pattern (1,2,4 Threads)


Database Pattern (1,2,4 Threads)


Webserver Pattern (1,2,4 Threads)


