Gigabyte GeForce GTX 670 OC Windforce 3X im Test (16/17)
GIGABYTE GeForce GTX 670 OC Windforce Overclocking
GPU-Boost und Base/Boost-Clock Overclocking - Was bringt es
Zur erinnerung und für alle die, die sich bisher nicht mit dem Thema
Overclocking einer GTX 680/670 befasst haben, weisen wir noch einmal auf das
Overclocking des Referenzdesigns der GeForce GTX 680 hin. Ebenso sind
wir bereits ausführlich auf das
Overclocking der GeForce GTX 670 eingegangen. Wie wird dort gesehen
haben arbeitet die GPU der Karten dank GPU-Boost zum Teil deutlich über dem
eingestellten Boost-Clock. Der eigentliche Base-Clock wird
zumeist nur dann angesteuert, wenn das Power-Limit der Karte sehr im
Grenzbereich liegt.
Die GIGABYTE GeForce GTX 670 Windforce 3X hat zwar nur einen moderat
erhöhten Boost-Takt von 1058 MHz, taktet aber wie gehabt ebenfalls deutlich
höher. Zudem hat die Karte mit dem PCB der 680 und einem 8 und 6 Pol PCIe Stecker
ein angehobenes Power-Limit. Die Karte erlaubt also mehr Strom zu ziehen als
eine übliche GTX 670. Das Power-Limit kann daher per Software auch nur noch
um 11%
erhöht werden.
Mit den Standard-Einstellungen testen wir auch bei dieser Karte erneut
wie sie in den 4 Game Tests von 3DMark 11 taktet, da diese schön
verschiedene Game Situationen darstellen. Eine normale GeForce GTX 670/680
schwankt im ersten und zweiten Test deutlich mit der Taktfrequenz und
erreicht schnell das
Powerlimit, im Test 3 und 4 dagegen kann GPU Boost gut hoch takten, da das
Powerlimit hier nicht erreicht wird. (Zu sehen in unserem ersten
GeForce GTX 680 Artikel unter GPU-Boost)
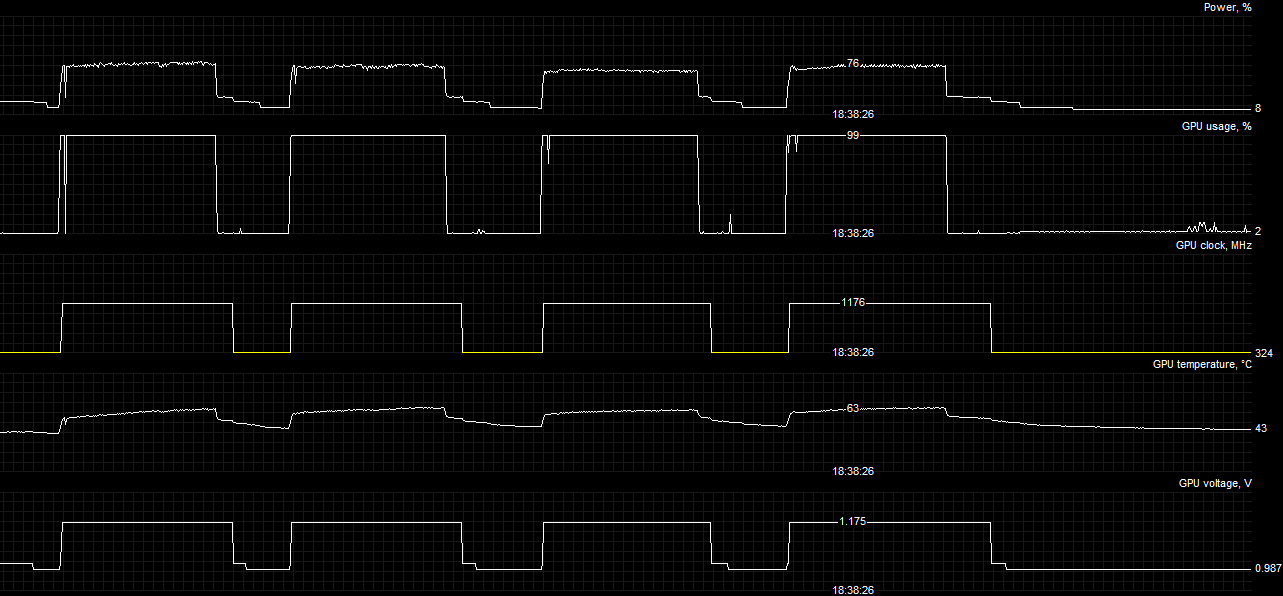
Wie bei der GIGABYTE GTX 680 OC auch schon zu sehen nagelt sich die GTX
670 ebenso im gesamten 3DMark 11 Test auf eine hohe
Taktrate fest. Es kommt nur sehr selten zu Einbrüchen des Takts. Die
Taktrate liegt in diesem Test bei unserem Modell der Karte bei satten 1176
MHz.
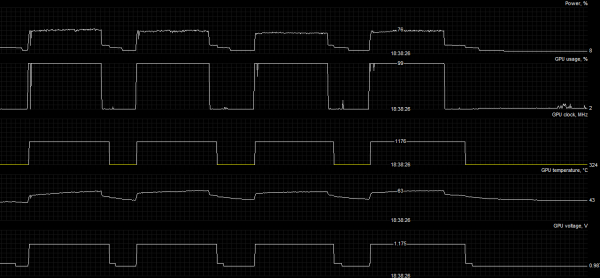
GIGABYTE GeForce GTX 680 Windforce mit Base-Clock 1176 MHz unter Furmark
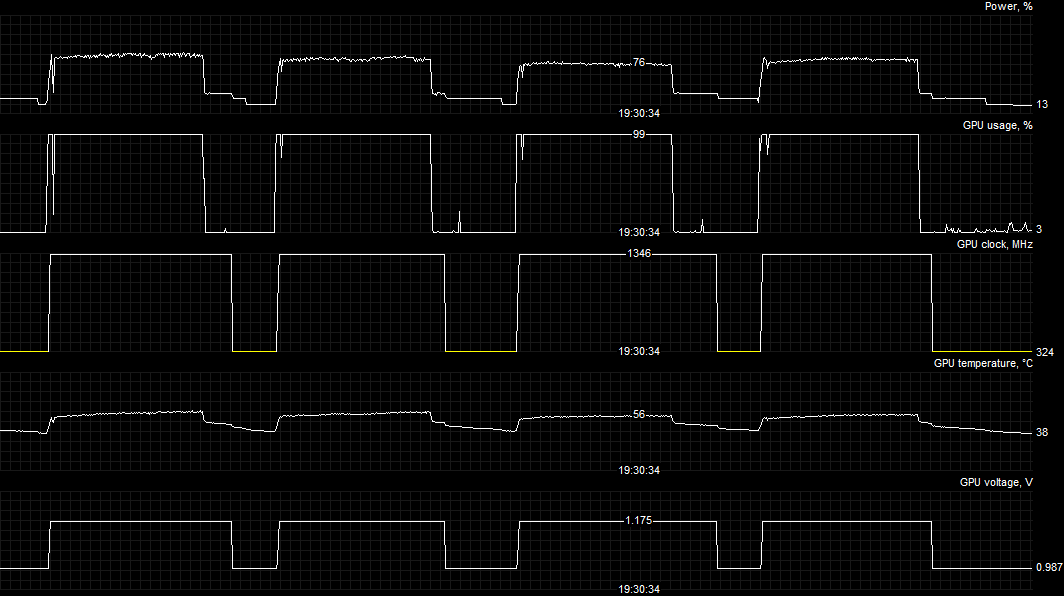
Das weitere übertakten der Karte ber Offset des Base-Clock geht bei der
GIGABYTE Karte ebenfalls mehr als gut recht Bis zu 170 MHz waren hier drin.
Damit erreichte die Karte dann im 3DMark 11 fantastische 1346 MHz, den
bisher besten Wert bei unseren Tests einer Kepler-Karte.
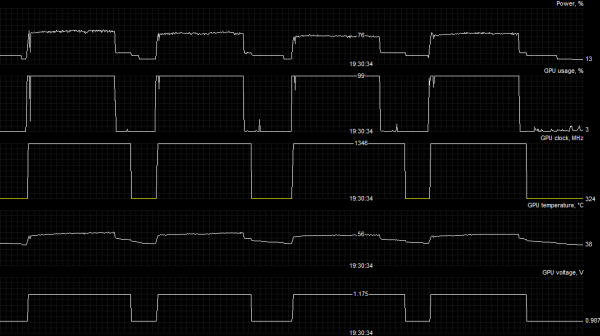
GIGABYTE GeForce GTX 680 Windforce mit Base-Clock 1346
MHz in 3dMark
Natürlich ist diese hohe Taktrate nicht in jedem Benchmark konstant und
je nach Güte der verbauten GPU können auch die Taktraten des gleichen
Modells einer GeForce GTX 670 unterschiedlich ausfallen.
3DMark 2011
NVIDIA GeForce GTX 690 | GIGABYTE GeForce GTX 670 OC+ | AMD Radeon HD 6990 | NVIDIA GeForce GTX 680 | GIGABYTE GeForce GTX 670 OC | Gainward GeForce GTX 670 Phantom | NVIDIA GeForce GTX 590 | AMD Radeon HD 7970 | AMD Radeon HD 7950 | AMD Radeon HD 7870 | NVIDIA GeForce GTX 580 | AMD Radeon HD 6970 | NVIDIA GeForce GTX 570 | NVIDIA GeForce GTX 480 | AMD Radeon HD 7850 | AMD Radeon HD 6950 | ATI Radeon HD 5870 | NVIDIA GeForce GTX 560 TI | NVIDIA GeForce GTX 470 | NVIDIA GeForce GTX 560 | AMD Radeon HD 6870 | ATI Radeon HD 5850 | AMD Radeon HD 6850 | AMD Radeon HD 7770 | NVIDIA GeForce GTX 460 | NVIDIA GeForce GTX 465 | ATI Radeon HD 5770/6770 | NVIDIA GeForce GTS 450 |
|
 4855 [153%] 4855 [153%] |  3558 [112%] 3558 [112%] | | 3315 [104%] | | 3199 [101%] |  3179 [100%] 3179 [100%] | | 3139 [99%] | | 2985 [94%] | | 2704 [85%] | | 2252 [71%] | | 2032 [64%] | | 1952 [61%] | | 1819 [57%] | | 1695 [53%] | | 1682 [53%] | | 1620 [51%] | | 1612 [51%] | | 1579 [50%] | | 1412 [44%] | | 1342 [42%] | | 1312 [41%] | | 1311 [41%] | | 1311 [41%] | | 1130 [36%] | | 1086 [34%] | | 1052 [33%] | | 980 [31%] | | 890 [28%] | | 680 [21%] | | 3DMark 2011 - Extreme - |
|
|
3DMark 2011 GPU Score
NVIDIA GeForce GTX 690 | GIGABYTE GeForce GTX 670 OC+ | AMD Radeon HD 6990 | NVIDIA GeForce GTX 680 | GIGABYTE GeForce GTX 670 OC | Gainward GeForce GTX 670 Phantom | NVIDIA GeForce GTX 590 | AMD Radeon HD 7970 | AMD Radeon HD 7950 | AMD Radeon HD 7870 | NVIDIA GeForce GTX 580 | AMD Radeon HD 6970 | NVIDIA GeForce GTX 570 | NVIDIA GeForce GTX 480 | AMD Radeon HD 7850 | AMD Radeon HD 6950 | ATI Radeon HD 5870 | NVIDIA GeForce GTX 560 TI | NVIDIA GeForce GTX 470 | ATI Radeon HD 5850 | AMD Radeon HD 6870 | NVIDIA GeForce GTX 560 | AMD Radeon HD 6850 | AMD Radeon HD 7770 | NVIDIA GeForce GTX 460 | NVIDIA GeForce GTX 465 | ATI Radeon HD 5770/6770 | NVIDIA GeForce GTS 450 |
|
| 5508 [188%] | | 3296 [112%] | | 3042 [104%] | | 2959 [101%] | | 2931 [100%] | | 2887 [98%] | | 2821 [96%] | | 2472 [84%] | | 2042 [70%] | | 1846 [63%] | | 1767 [60%] | | 1636 [56%] | | 1533 [52%] | | 1515 [52%] | | 1451 [50%] | | 1446 [49%] | | 1417 [48%] | | 1264 [43%] | | 1206 [41%] | | 1171 [40%] | | 1169 [40%] | | 1164 [40%] | | 1003 [34%] | | 973 [33%] | | 939 [32%] | | 874 [30%] | | 794 [27%] | | 606 [21%] | | 3DMark 2011 GPU Score - Extreme - |
|
|
3DMark Vantage
NVIDIA GeForce GTX 690 | NVIDIA GeForce GTX 590 | GIGABYTE GeForce GTX 670 OC+ | NVIDIA GeForce GTX 680 | AMD Radeon HD 6990 | Gainward GeForce GTX 670 Phantom | GIGABYTE GeForce GTX 670 OC | AMD Radeon HD 7970 | AMD Radeon HD 7950 | NVIDIA GeForce GTX 580 | AMD Radeon HD 7870 | NVIDIA GeForce GTX 570 | AMD Radeon HD 6970 | NVIDIA GeForce GTX 480 | AMD Radeon HD 7850 | ATI Radeon HD 5870 | NVIDIA GeForce GTX 560 TI | AMD Radeon HD 6950 | NVIDIA GeForce GTX 560 | NVIDIA GeForce GTX 470 | AMD Radeon HD 6870 | ATI Radeon HD 5850 | NVIDIA GeForce GTX 460 | ATI Radeon HD 5830 | AMD Radeon HD 7770 | AMD Radeon HD 6850 | NVIDIA GeForce GTX 460 768 | NVIDIA GeForce GTX 285 | NVIDIA GeForce GTX 465 | NVIDIA GeForce GTX 275 | ATI Radeon HD 4890 | NVIDIA GeForce GTX 260 | NVIDIA GeForce GTS 450 | ATI Radeon HD 5770/6770 | ATI Radeon HD 4870 | ATI Radeon HD 5750/6750 | ATI Radeon HD 5750 512 | ATI Radeon HD 4850 | ATI Radeon HD 4770 |
|
| 29433 [161%] | | 20799 [114%] | | 20388 [111%] | | 18851 [103%] | | 18370 [100%] | | 18329 [100%] | | 18311 [100%] | | 17392 [95%] | | 14067 [77%] | | 12892 [70%] | | 12174 [66%] | | 11144 [61%] | | 10870 [59%] | | 9969 [54%] | | 9622 [53%] | | 9382 [51%] | | 9369 [51%] | | 9363 [51%] | | 8251 [45%] | | 7908 [43%] | | 7661 [42%] | | 7528 [41%] | | 6904 [38%] | | 6705 [37%] | | 6375 [35%] | | 6094 [33%] | | 6056 [33%] | | 6042 [33%] | | 6000 [33%] | | 5670 [31%] | | 4938 [27%] | | 4687 [26%] | | 4396 [24%] | | 4354 [24%] | | 4142 [23%] | | 3516 [19%] | | 3300 [18%] | | 3254 [18%] | | 3125 [17%] | | 3D Mark Vantage - 1920x1080 Extreme - |
|
|
3DMark Vantage GPU Score
NVIDIA GeForce GTX 690 | NVIDIA GeForce GTX 590 | GIGABYTE GeForce GTX 670 OC+ | NVIDIA GeForce GTX 680 | AMD Radeon HD 6990 | Gainward GeForce GTX 670 Phantom | GIGABYTE GeForce GTX 670 OC | AMD Radeon HD 7970 | AMD Radeon HD 7950 | NVIDIA GeForce GTX 580 | AMD Radeon HD 7870 | NVIDIA GeForce GTX 570 | AMD Radeon HD 6970 | NVIDIA GeForce GTX 480 | AMD Radeon HD 7850 | ATI Radeon HD 5870 | NVIDIA GeForce GTX 560 TI | AMD Radeon HD 6950 | NVIDIA GeForce GTX 560 | NVIDIA GeForce GTX 470 | AMD Radeon HD 6870 | ATI Radeon HD 5850 | NVIDIA GeForce GTX 460 | ATI Radeon HD 5830 | AMD Radeon HD 7770 | AMD Radeon HD 6850 | NVIDIA GeForce GTX 460 768 | NVIDIA GeForce GTX 285 | NVIDIA GeForce GTX 465 | NVIDIA GeForce GTX 275 | ATI Radeon HD 4890 | NVIDIA GeForce GTX 260 | NVIDIA GeForce GTS 450 | ATI Radeon HD 5770/6770 | ATI Radeon HD 4870 | ATI Radeon HD 5750/6750 | ATI Radeon HD 5750 512 | ATI Radeon HD 4850 | ATI Radeon HD 4770 |
|
| 29960 [165%] | | 20736 [114%] | | 20308 [112%] | | 18703 [103%] | | 18197 [100%] | | 18167 [100%] | | 18154 [100%] | | 17194 [95%] | | 13802 [76%] | | 12613 [69%] | | 11898 [66%] | | 10859 [60%] | | 10582 [58%] | | 9688 [53%] | | 9342 [51%] | | 9103 [50%] | | 9092 [50%] | | 9088 [50%] | | 7985 [44%] | | 7648 [42%] | | 7405 [41%] | | 7276 [40%] | | 6661 [37%] | | 6466 [36%] | | 6146 [34%] | | 5869 [32%] | | 5831 [32%] | | 5819 [32%] | | 5778 [32%] | | 5416 [30%] | | 4743 [26%] | | 4500 [25%] | | 4197 [23%] | | 4177 [23%] | | 3972 [22%] | | 3366 [19%] | | 3158 [17%] | | 3114 [17%] | | 2989 [16%] | | 3D Mark GPU Score - 1920x1080 Extreme - |
|
|
Heaven 2.1 Extreme Mode
NVIDIA GeForce GTX 690 | NVIDIA GeForce GTX 590 | NVIDIA GeForce GTX 680 | GIGABYTE GeForce GTX 670 OC | Gainward GeForce GTX 670 Phantom | AMD Radeon HD 6990 | AMD Radeon HD 7970 | AMD Radeon HD 7950 | NVIDIA GeForce GTX 580 | AMD Radeon HD 6970 | AMD Radeon HD 7870 | NVIDIA GeForce GTX 570 | AMD Radeon HD 6950 | NVIDIA GeForce GTX 480 | AMD Radeon HD 7850 | NVIDIA GeForce GTX 470 | NVIDIA GeForce GTX 560 TI | AMD Radeon HD 7770 | AMD Radeon HD 6870 | ATI Radeon HD 5870 | NVIDIA GeForce GTX 560 | AMD Radeon HD 6850 | NVIDIA GeForce GTX 465 | ATI Radeon HD 5850 | NVIDIA GeForce GTX 460 | ATI Radeon HD 5830 | NVIDIA GeForce GTX 460 768 | ATI Radeon HD 5770/6770 | NVIDIA GeForce GTS 450 | ATI Radeon HD 5750/6750 |
|
| 87.6 [185%] | | 51 [108%] | | 49.5 [105%] | | 47.3 [100%] | | 47.3 [100%] | | 45.7 [97%] | | 41.6 [88%] | | 36 [76%] | | 34.3 [73%] | | 32.8 [69%] | | 31.4 [66%] | | 29.8 [63%] | | 28.9 [61%] | | 28.6 [60%] | | 28.1 [59%] | | 22.6 [48%] | | 22.4 [47%] | | 21.8 [46%] | | 21.1 [45%] | | 20.6 [44%] | | 19.6 [41%] | | 17.8 [38%] | | 17.6 [37%] | | 17.3 [37%] | | 16.7 [35%] | | 16.3 [34%] | | 15.7 [33%] | | 11.9 [25%] | | 10.7 [23%] | | 5.9 [12%] | | Heaven 2.5 Pro (DX11/Extreme) - 1920x1200 4AAx16AF |
|
|
Alien vs. Predator Benchmark
NVIDIA GeForce GTX 690 | AMD Radeon HD 6990 | NVIDIA GeForce GTX 590 | AMD Radeon HD 7970 | GIGABYTE GeForce GTX 670 OC+ | Gainward GeForce GTX 670 Phantom | GIGABYTE GeForce GTX 670 OC | NVIDIA GeForce GTX 680 | AMD Radeon HD 7950 | NVIDIA GeForce GTX 580 | AMD Radeon HD 6970 | AMD Radeon HD 7870 | NVIDIA GeForce GTX 480 | AMD Radeon HD 6950 | NVIDIA GeForce GTX 570 | AMD Radeon HD 7850 | ATI Radeon HD 5870 | NVIDIA GeForce GTX 560 TI | NVIDIA GeForce GTX 470 | NVIDIA GeForce GTX 560 | AMD Radeon HD 6870 | ATI Radeon HD 5850 | NVIDIA GeForce GTX 460 | AMD Radeon HD 6850 | AMD Radeon HD 7770 | ATI Radeon HD 5770/6770 | ATI Radeon HD 5830 | NVIDIA GeForce GTS 450 |
|
| 97.7 [185%] | | 76.8 [145%] | | 67 [127%] | | 59.3 [112%] | | 58.8 [111%] | | 53.1 [100%] | | 52.9 [100%] | | 52 [98%] | | 49.8 [94%] | | 42.7 [81%] | | 41.8 [79%] | | 41.6 [79%] | | 37.2 [70%] | | 36.3 [69%] | | 35.9 [68%] | | 34.7 [66%] | | 31.4 [59%] | | 30.1 [57%] | | 29.3 [55%] | | 26.8 [51%] | | 26.4 [50%] | | 26.1 [49%] | | 22.9 [43%] | | 22.4 [42%] | | 21.1 [40%] | | 21.1 [40%] | | 21 [40%] | | 15.6 [29%] | | Alien vs Predator (DX11) - 1920x1200 4AAx16AF |
|
|
Battleforge
NVIDIA GeForce GTX 690 | NVIDIA GeForce GTX 590 | GIGABYTE GeForce GTX 670 OC+ | AMD Radeon HD 6990 | GIGABYTE GeForce GTX 670 OC | NVIDIA GeForce GTX 680 | Gainward GeForce GTX 670 Phantom | AMD Radeon HD 7970 | AMD Radeon HD 7950 | NVIDIA GeForce GTX 580 | AMD Radeon HD 7870 | NVIDIA GeForce GTX 570 | NVIDIA GeForce GTX 480 | AMD Radeon HD 7850 | NVIDIA GeForce GTX 560 TI | NVIDIA GeForce GTX 470 | AMD Radeon HD 6970 | ATI Radeon HD 5870 | NVIDIA GeForce GTX 560 | AMD Radeon HD 6950 | AMD Radeon HD 6870 | ATI Radeon HD 5850 | NVIDIA GeForce GTX 465 | AMD Radeon HD 7770 | AMD Radeon HD 6850 | NVIDIA GeForce GTX 460 | ATI Radeon HD 5830 | NVIDIA GeForce GTX 460 768 | ATI Radeon HD 5770/6770 | ATI Radeon HD 4890 | ATI Radeon HD 4870 | NVIDIA GeForce GTS 450 | ATI Radeon HD 5750/6750 | NVIDIA GeForce GTX 285 | ATI Radeon HD 5750 512 | NVIDIA GeForce GTX 275 | NVIDIA GeForce GTX 260 | ATI Radeon HD 4850 | ATI Radeon HD 4770 |
|
| 174.1 [180%] | | 115.2 [119%] | | 103.2 [107%] | | 98.8 [102%] | | 96.9 [100%] | | 96.3 [99%] | | 96.3 [99%] | | 95.4 [98%] | | 81.9 [85%] | | 72.1 [74%] | | 71.4 [74%] | | 63.8 [66%] | | 62.5 [64%] | | 61.9 [64%] | | 49.9 [51%] | | 49.9 [51%] | | 48 [50%] | | 46.9 [48%] | | 44.6 [46%] | | 42.1 [43%] | | 40.9 [42%] | | 39.5 [41%] | | 39.3 [41%] | | 35.8 [37%] | | 35.3 [36%] | | 34.7 [36%] | | 33 [34%] | | 32.8 [34%] | | 27.4 [28%] | | 24.9 [26%] | | 22.2 [23%] | | 22.2 [23%] | | 21.3 [22%] | | 21.1 [22%] | | 19.6 [20%] | | 19.1 [20%] | | 17.3 [18%] | | 14.9 [15%] | | 13.8 [14%] | | Battleforge (SSAO/DX11) - 1920x1200 4AAx16AF |
|
|
Dirt2
NVIDIA GeForce GTX 690 | NVIDIA GeForce GTX 590 | GIGABYTE GeForce GTX 670 OC+ | NVIDIA GeForce GTX 680 | GIGABYTE GeForce GTX 670 OC | Gainward GeForce GTX 670 Phantom | AMD Radeon HD 6990 | AMD Radeon HD 7970 | NVIDIA GeForce GTX 580 | AMD Radeon HD 7950 | NVIDIA GeForce GTX 570 | AMD Radeon HD 7870 | NVIDIA GeForce GTX 480 | AMD Radeon HD 7850 | AMD Radeon HD 6970 | NVIDIA GeForce GTX 560 TI | NVIDIA GeForce GTX 560 | NVIDIA GeForce GTX 470 | ATI Radeon HD 5870 | AMD Radeon HD 6950 | AMD Radeon HD 6870 | NVIDIA GeForce GTX 460 | ATI Radeon HD 5850 | NVIDIA GeForce GTX 460 768 | AMD Radeon HD 6850 | NVIDIA GeForce GTX 465 | AMD Radeon HD 7770 | ATI Radeon HD 5830 | ATI Radeon HD 4870 | ATI Radeon HD 5770/6770 | NVIDIA GeForce GTS 450 | ATI Radeon HD 5750/6750 | ATI Radeon HD 5750 512 |
|
| 164.5 [111%] | | 160.8 [109%] | | 153.1 [103%] | | 149.2 [101%] | | 148.2 [100%] | | 148 [100%] | | 124.5 [84%] | | 120 [81%] | | 111.5 [75%] | | 104.4 [70%] | | 96.5 [65%] | | 95.1 [64%] | | 90.8 [61%] | | 83.9 [57%] | | 83.3 [56%] | | 82.3 [56%] | | 74.1 [50%] | | 73.5 [50%] | | 72.3 [49%] | | 71.2 [48%] | | 65 [44%] | | 63.4 [43%] | | 62 [42%] | | 58.2 [39%] | | 57.7 [39%] | | 56.6 [38%] | | 54.8 [37%] | | 53.5 [36%] | | 51.5 [35%] | | 43.6 [29%] | | 40.2 [27%] | | 31.5 [21%] | | 30.6 [21%] | | Dirt 2 (DX11) - 1920x1200 4AAx16AF |
|
|


 Zurück:
  Weiter: