Mach Xtreme MX-DS SSD (S-F Serie) Test (7/12)
Benchmark CrystalDiskMark 3
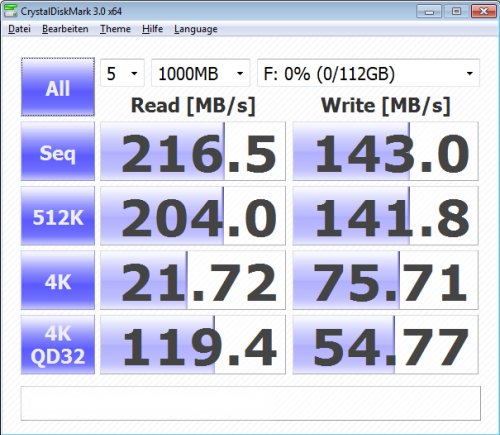
Lesen, Schreiben in Sequentiell und Random sowie 4K Zugriffe
Beim CrystalDiskMark zeigen sich sehr schon, das die Mach Xtreme sehr
gute Werte abliefert aber bei den 4K Writes gegen andere SSDs ohne 30K
Schranke zurückfällt. In der Praxis wirkt sich dies jedoch deutlich geringer
aus, als es hier im Benchmark zu erkennen ist.
CrystalDiskMark Lesen
OCZ Vertex 3 240 | Intel 510 Series 120 Raid 0 | Intel 510 Series 250 | Intel 510 Series 120 | Crucial RealSSD C300 SATA III | Crucial RealSSD C300 SATA II | Intel 510 Series 250 SATA 2 | Intel 510 Series 120 SATA 2 | G.Skill Phoenix EVO | G.Skill Phoenix 100 | OCZ Vertex 2 Extended 120 | G.Skill Phoenix Pro 120 | Mach Xtreme MX-DS 120 | Kingston SSDNow V+ Drive 128 | OCZ Vertex LE Limited Edition | Intel 320 Series 300 | OCZ Vertex Turbo 120 1.5 | G.Skill Falcon 128 | OCZ Vertex 120 1.5 | Kingston SSDNow V-Series G2 128 | G.Skill FM-25S2S | Corsair F40 Force | OCZ Enyo USB3.0 | OCZ Enyo USB2.0 | WD Raptor X WD15000AHFD |
|
 469 [100%] | | 428.3 [91%] | | 334.6 [71%] | | 325.7 [69%] | | 324 [69%] | | 269.8 [58%] | | 232.5 [50%] | | 231.1 [49%] | | 220.5 [47%] | | 218.6 [47%] | | 206.5 [44%] | | 205.9 [44%] |  205.8 [44%] | | 205.4 [44%] | | 204.1 [44%] | | 180.7 [39%] | | 176.8 [38%] | | 163.4 [35%] | | 162.8 [35%] | | 155.5 [33%] | | 152.9 [33%] | | 145.2 [31%] | | 140.1 [30%] | | 65 [14%] | | 30.9 [7%] | | CrystalDiskMark - Random Read 512KB - |
|
|
OCZ Vertex 3 240 | Crucial RealSSD C300 SATA II | Crucial RealSSD C300 SATA III | OCZ Vertex Turbo 120 1.5 | G.Skill Falcon 128 | OCZ Vertex 120 1.5 | OCZ Vertex 2 Extended 120 | Intel 320 Series 300 | Mach Xtreme MX-DS 120 | G.Skill Phoenix 100 | G.Skill Phoenix Pro 120 | OCZ Vertex LE Limited Edition | Intel 510 Series 120 | Intel 510 Series 120 SATA 2 | Intel 510 Series 120 Raid 0 | Intel 510 Series 250 | Intel 510 Series 250 SATA 2 | Kingston SSDNow V+ Drive 128 | Corsair F40 Force | G.Skill Phoenix EVO | G.Skill FM-25S2S | OCZ Enyo USB3.0 | Kingston SSDNow V-Series G2 128 | OCZ Enyo USB2.0 | WD Raptor X WD15000AHFD |
|
| 36.9 [100%] | | 33.5 [91%] | | 31.4 [85%] | | 30.8 [83%] | | 29.1 [79%] | | 27.8 [75%] | | 23.1 [63%] | | 22.9 [62%] | | 22.9 [62%] | | 22.8 [62%] | | 22.8 [62%] | | 21.9 [59%] | | 21.2 [57%] | | 21.1 [57%] | | 20.4 [55%] | | 20.3 [55%] | | 20.3 [55%] | | 19.9 [54%] | | 19.6 [53%] | | 18.7 [51%] | | 18.5 [50%] | | 18.1 [49%] | | 10.9 [30%] | | 8 [22%] | | 0.8 [2%] | | CrystalDiskMark - Random Read 4KB (QD=1) - |
|
|
Crucial RealSSD C300 SATA II | OCZ Vertex 3 240 | Crucial RealSSD C300 SATA III | Intel 510 Series 120 Raid 0 | Intel 320 Series 300 | Mach Xtreme MX-DS 120 | OCZ Vertex 2 Extended 120 | G.Skill Phoenix 100 | G.Skill Phoenix Pro 120 | OCZ Vertex LE Limited Edition | Intel 510 Series 120 SATA 2 | G.Skill Phoenix EVO | Intel 510 Series 120 | Intel 510 Series 250 SATA 2 | Corsair F40 Force | Intel 510 Series 250 | OCZ Vertex Turbo 120 1.5 | G.Skill Falcon 128 | OCZ Vertex 120 1.5 | OCZ Enyo USB3.0 | G.Skill FM-25S2S | Kingston SSDNow V+ Drive 128 | Kingston SSDNow V-Series G2 128 | OCZ Enyo USB2.0 | WD Raptor X WD15000AHFD |
|
| 198.8 [100%] | | 195.1 [98%] | | 185.1 [93%] | | 168.7 [85%] | | 141.2 [71%] | | 133.4 [67%] | | 133.1 [67%] | | 128.6 [65%] | | 124.1 [62%] | | 115.7 [58%] | | 88.1 [44%] | | 88 [44%] | | 86.4 [43%] | | 83.8 [42%] | | 83.2 [42%] | | 80.8 [41%] | | 70.1 [35%] | | 65.1 [33%] | | 65.1 [33%] | | 20.4 [10%] | | 19.4 [10%] | | 18.7 [9%] | | 11.1 [6%] | | 8 [4%] | | 1 [1%] | | CrystalDiskMark - Random Read 4KB (QD=32) - |
|
|
CrystalDiskMark Schreiben
Intel 510 Series 120 Raid 0 | Intel 510 Series 250 | OCZ Vertex 3 240 | Intel 510 Series 250 SATA 2 | Intel 320 Series 300 | Intel 510 Series 120 | Intel 510 Series 120 SATA 2 | Kingston SSDNow V-Series G2 128 | Kingston SSDNow V+ Drive 128 | OCZ Enyo USB3.0 | OCZ Vertex Turbo 120 1.5 | OCZ Vertex 120 1.5 | Mach Xtreme MX-DS 120 | Crucial RealSSD C300 SATA III | OCZ Vertex 2 Extended 120 | G.Skill Phoenix Pro 120 | G.Skill Falcon 128 | G.Skill Phoenix 100 | OCZ Vertex LE Limited Edition | Crucial RealSSD C300 SATA II | G.Skill FM-25S2S | WD Raptor X WD15000AHFD | G.Skill Phoenix EVO | Corsair F40 Force | OCZ Enyo USB2.0 |
|
| 421.3 [100%] | | 331.1 [79%] | | 301.3 [72%] | | 258.1 [61%] | | 229.3 [54%] | | 209 [50%] | | 205.5 [49%] | | 185 [44%] | | 184.9 [44%] | | 175.3 [42%] | | 147.9 [35%] | | 144.3 [34%] | | 143.4 [34%] | | 142.6 [34%] | | 142.4 [34%] | | 141 [33%] | | 140.8 [33%] | | 140.6 [33%] | | 140.4 [33%] | | 139.8 [33%] | | 96.7 [23%] | | 83.8 [20%] | | 80.7 [19%] | | 73 [17%] | | 31 [7%] | | CrystalDiskMark - Sequential Write - |
|
|
Intel 510 Series 120 Raid 0 | Intel 510 Series 250 | OCZ Vertex 3 240 | Intel 510 Series 250 SATA 2 | Intel 320 Series 300 | Intel 510 Series 120 | Intel 510 Series 120 SATA 2 | OCZ Enyo USB3.0 | Crucial RealSSD C300 SATA III | Mach Xtreme MX-DS 120 | OCZ Vertex 2 Extended 120 | Crucial RealSSD C300 SATA II | G.Skill Phoenix 100 | G.Skill Phoenix Pro 120 | OCZ Vertex LE Limited Edition | OCZ Vertex Turbo 120 1.5 | Kingston SSDNow V+ Drive 128 | OCZ Vertex 120 1.5 | Kingston SSDNow V-Series G2 128 | G.Skill Falcon 128 | G.Skill Phoenix EVO | Corsair F40 Force | WD Raptor X WD15000AHFD | G.Skill FM-25S2S | OCZ Enyo USB2.0 |
|
| 387.9 [100%] | | 304.6 [79%] | | 300 [77%] | | 246.4 [64%] | | 219.7 [57%] | | 198.6 [51%] | | 193.6 [50%] | | 152.2 [39%] | | 144.7 [37%] | | 141.8 [37%] | | 140.9 [36%] | | 140.5 [36%] | | 139 [36%] | | 138.9 [36%] | | 138.6 [36%] | | 123.7 [32%] | | 119.2 [31%] | | 117.2 [30%] | | 111.2 [29%] | | 110.8 [29%] | | 80.4 [21%] | | 72.1 [19%] | | 50.5 [13%] | | 48.9 [13%] | | 31 [8%] | | CrystalDiskMark - Random Write 512KB - |
|
|
OCZ Vertex 3 240 | OCZ Vertex 2 Extended 120 | G.Skill Phoenix 100 | Mach Xtreme MX-DS 120 | G.Skill Phoenix Pro 120 | Crucial RealSSD C300 SATA II | OCZ Vertex LE Limited Edition | Crucial RealSSD C300 SATA III | Corsair F40 Force | G.Skill Phoenix EVO | Intel 510 Series 120 SATA 2 | Intel 320 Series 300 | Intel 510 Series 120 | Intel 510 Series 250 SATA 2 | Intel 510 Series 250 | Intel 510 Series 120 Raid 0 | Kingston SSDNow V-Series G2 128 | OCZ Vertex Turbo 120 1.5 | OCZ Vertex 120 1.5 | G.Skill Falcon 128 | Kingston SSDNow V+ Drive 128 | OCZ Enyo USB3.0 | OCZ Enyo USB2.0 | G.Skill FM-25S2S | WD Raptor X WD15000AHFD |
|
| 108 [100%] | | 94.1 [87%] | | 93.8 [87%] | | 92.7 [86%] | | 92.2 [85%] | | 86.6 [80%] | | 77.9 [72%] | | 74.6 [69%] | | 71 [66%] | | 67.7 [63%] | | 48.8 [45%] | | 48.6 [45%] | | 47.2 [44%] | | 46.4 [43%] | | 45.9 [42%] | | 45.8 [42%] | | 17.2 [16%] | | 12.4 [11%] | | 12.2 [11%] | | 11.9 [11%] | | 10.6 [10%] | | 9.8 [9%] | | 8 [7%] | | 1.8 [2%] | | 1.6 [1%] | | CrystalDiskMark - Random Write 4KB (QD=1) - |
|
|
OCZ Vertex 3 240 | Crucial RealSSD C300 SATA III | Crucial RealSSD C300 SATA II | OCZ Vertex 2 Extended 120 | Intel 510 Series 120 Raid 0 | G.Skill Phoenix Pro 120 | OCZ Vertex LE Limited Edition | G.Skill Phoenix EVO | Corsair F40 Force | Intel 320 Series 300 | Intel 510 Series 120 SATA 2 | Intel 510 Series 120 | G.Skill Phoenix 100 | Mach Xtreme MX-DS 120 | Intel 510 Series 250 SATA 2 | Intel 510 Series 250 | Kingston SSDNow V+ Drive 128 | Kingston SSDNow V-Series G2 128 | OCZ Vertex Turbo 120 1.5 | OCZ Vertex 120 1.5 | G.Skill Falcon 128 | OCZ Enyo USB3.0 | OCZ Enyo USB2.0 | G.Skill FM-25S2S | WD Raptor X WD15000AHFD |
|
| 246.1 [100%] | | 139.2 [57%] | | 134.2 [55%] | | 130.9 [53%] | | 130.2 [53%] | | 129.2 [52%] | | 128.1 [52%] | | 80.3 [33%] | | 71.5 [29%] | | 69.1 [28%] | | 65.7 [27%] | | 65.3 [27%] | | 57.2 [23%] | | 54.4 [22%] | | 51.1 [21%] | | 51 [21%] | | 18.2 [7%] | | 15 [6%] | | 12.3 [5%] | | 11.9 [5%] | | 11.7 [5%] | | 9.8 [4%] | | 8 [3%] | | 1.9 [1%] | | 1.6 [1%] | | CrystalDiskMark - Random Write 4KB (QD=32) - |
|
|
Inhaltsverzeichnis: Übersicht der Benchmarks in diesem Artikel: |
×
![]()
|

 Zurück:
 Weiter: